


Time of day analysis for mybiketraffic.com
Vehicle counts and speeds based on time of day

This post presents my initial time of day analysis results broken down by hours. I say "initial" because there is so much more I can do with this data. The easiest initial statistic for me to calculate was average traffic density and rider volume based on time of day. Narrator Note: it was not easy.
RESULTS AND ANALYSIS
In terms of traffic density (cars per minute), 7am and 8am are the busiest hours you can ride your bike on a weekday. The next two densest times are 4pm and 5pm with 4pm winning out by quite a bit over 5pm. Surprisingly (to me), the 5pm hour has the highest rider volume. This must reflect a large population riding after work or on their way home from work.

On the weekend, the results change dramatically. Noon and 5pm are the densest time of day on the weekend. Note that the peak rider volume shifts earlier in the day to 10 and 11am on the weekends, whereas traffic density is more evenly spread out throughout the day. Also, note that there are more rides happening nearly every hour of the day on the weekend.

Grouping the hours into morning, noon, afternoon, all day, and all night and comparing weekdays vs weekend leads to these car densities:

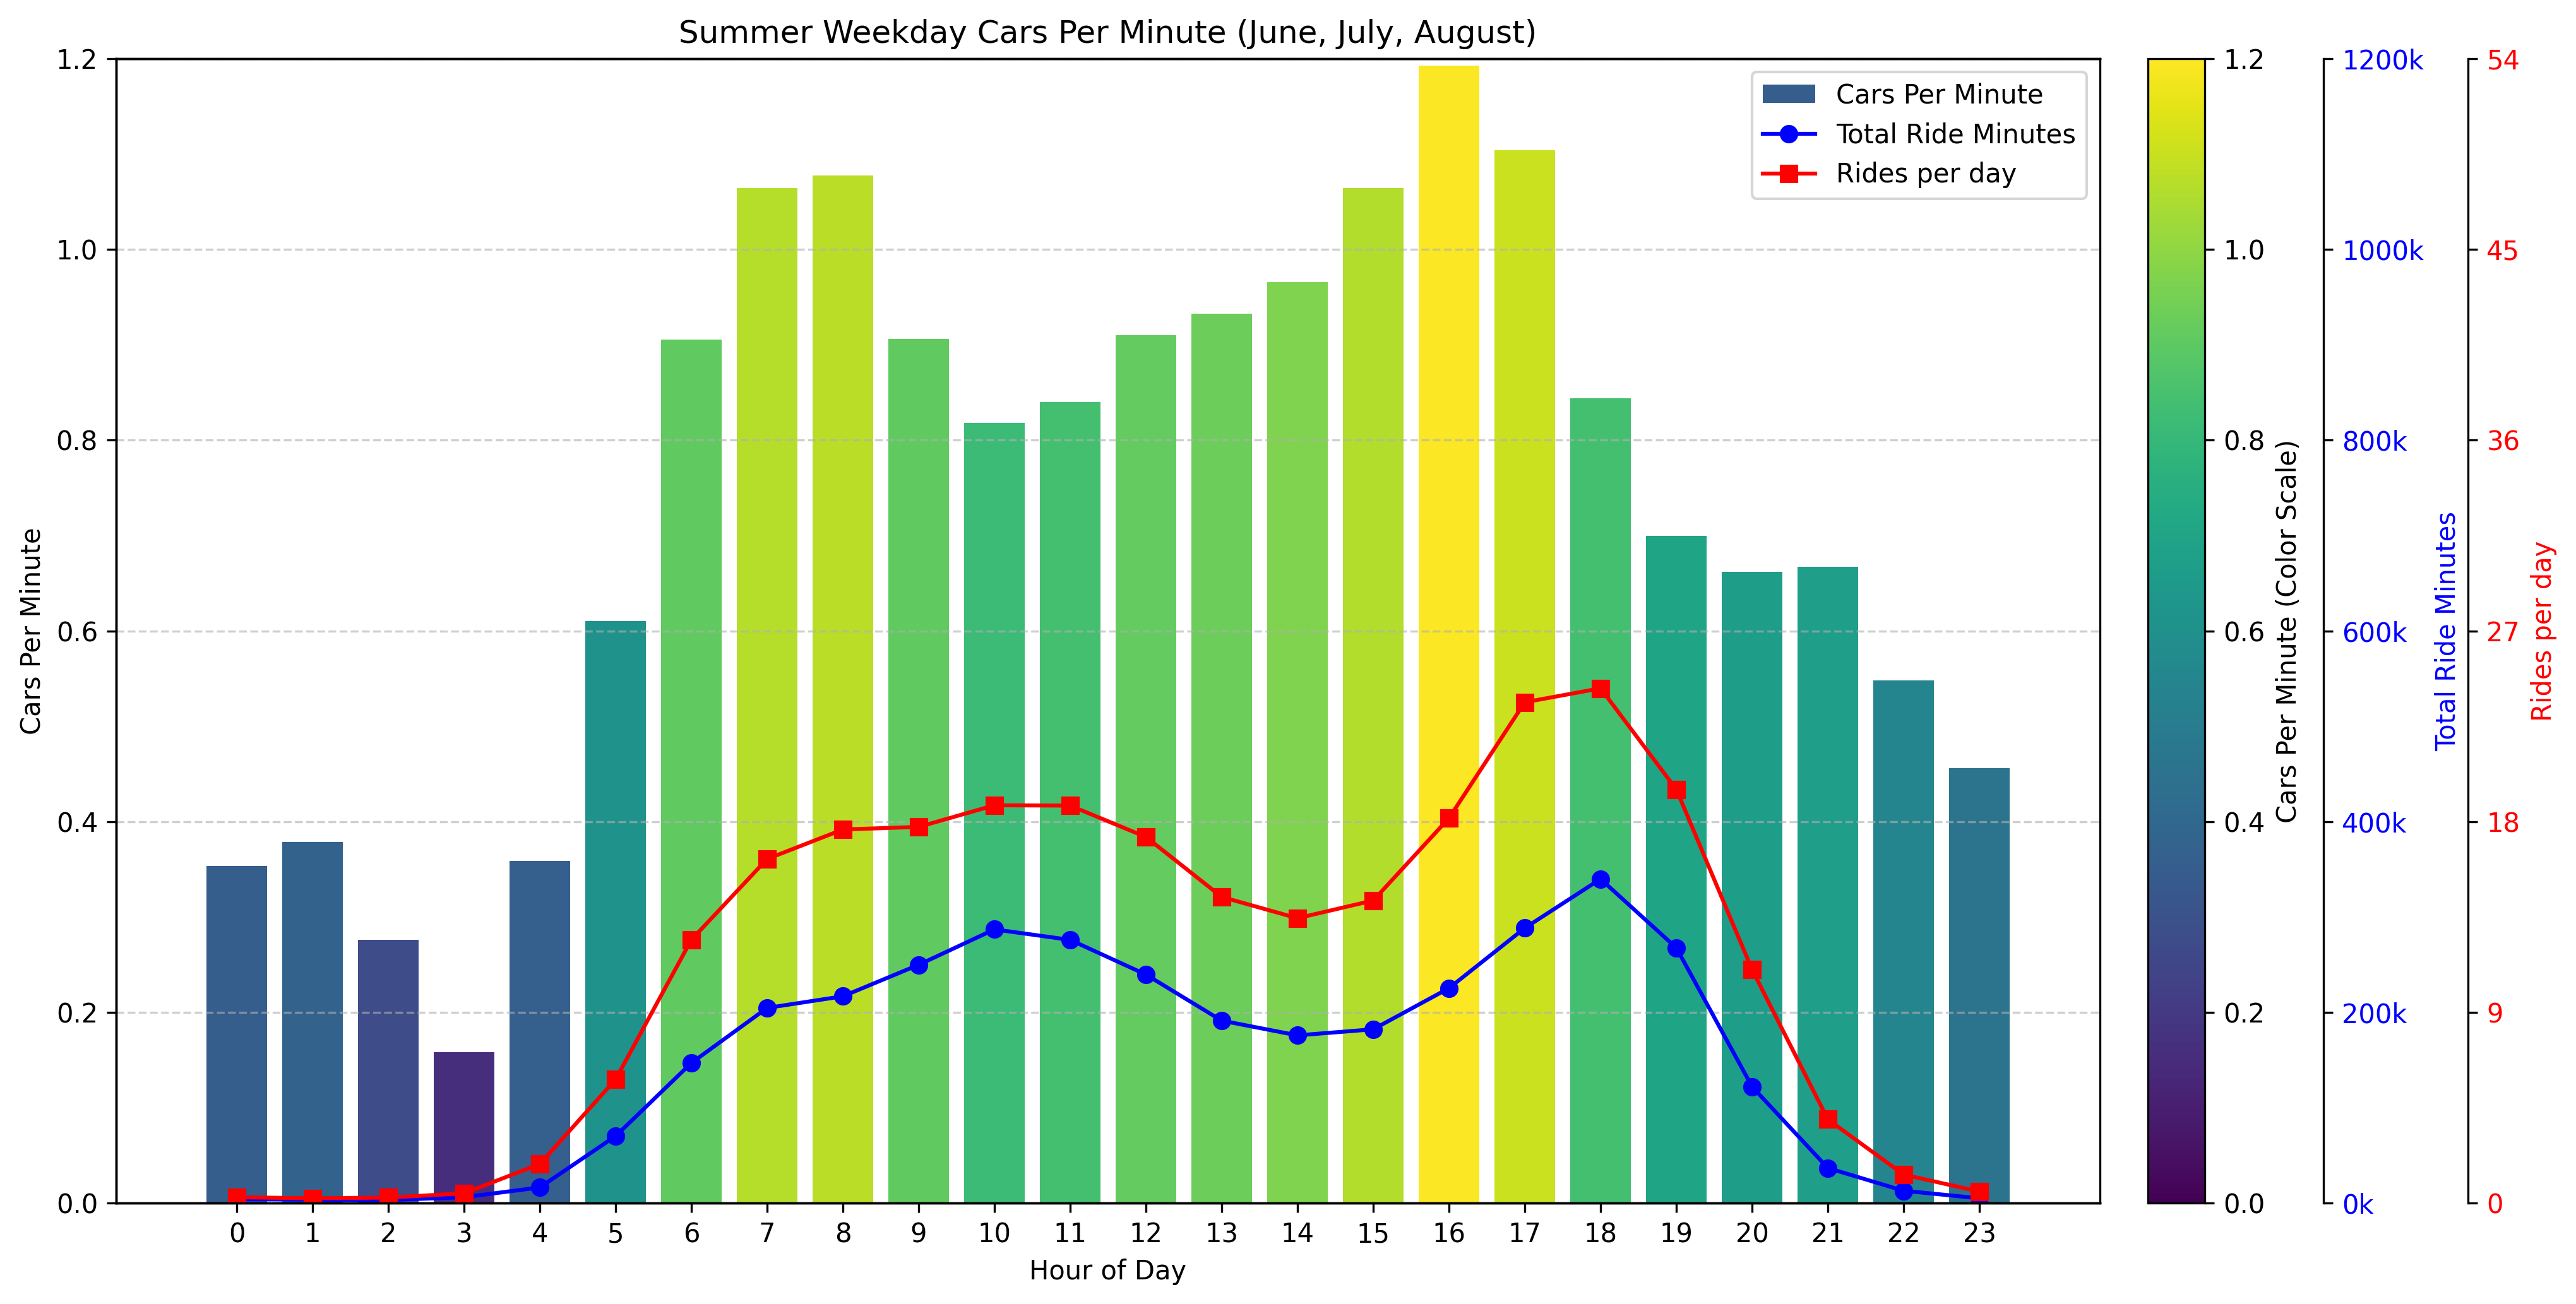
Differentiating between summer months (June, July, and August) and non-summer months leads to these results for weekdays and weekends.
Summer weekdays - 3,572,814 minutes total across all summer weekday ride
Summer weekends - 2,524,450 minutes across all summer weekend rides

Non-summer weekdays - 8,452,462 minutes across all non-summer weekday rides.

Non-summer weekends - 6,277,731 minutes across all non-summer weekend rides

CHART EXPLANATION
The blue line indicates the total number of minutes ridden collectively during each hour. Because the vehicle density is close to 1.0 cars per minute for many hours of the day, the blue line also represents a rough approximation of the total number of passes that were recorded during each hour across the entire dataset.
The rider volume (red line) is the normalized number of rides happening in that hour averaged across the total number of weekday / weekend days in the dataset. Normalizing the number makes it look much smaller than the total number of rides I am using to calculate the car densities, but the reason I chose to do this is so that you would have an apples-to-apples comparison between weekend/weekday/summer/non-summer rider volume.
The dataset analyzed for this study contained 188,793 rides from 7,342 riders in 91 different countries over a period of seven years. Most riders have joined this study within the last year or two. So this data is heavily skewed to 2023, 2024, and even 2025 data. But since I am not differentiating by year, this should not affect my results. I do have a large number of rides from earlier years and will be investigating the Covid impact of 2020 in a future post.
BACKGROUND
For those new to this project, I have built a Garmin ConnectIQ data field which collects and stores the radar readings from any compatible bicycle radar such as the Garmin Varia, Trek Carback, or any of the knock-off imitation devices.
This data field shows you on your Garmin head unit (watch or Edge handheld) how many cars have passed you during a ride along with the passing speeds of the approaching cars. Somewhere between 50k and 100k users have downloaded the data field (I was at 70k downloads when Garmin switched to only showing 50k, 100k, etc… on the ConnectIQ store page in 2024). I’ve got to be very close to 100k downloads soon!
Many users find the basic functionality of the app is all they need. But if you want to take an extra step to see on a map exactly where each car passed you, you have to create a free account on mybiketraffic.com. You can then setup your account to automatically sync your radar data across from Garmin Connect. Many users have done, this, and I have now collected data from almost 12,000 users riding in 97 different countries!
METHODOLOGY AND GOAL
The goal for this data analysis was to calculate normalized cars per minute based on time of day grouped into hour-long buckets. To do this, I needed to first calculate how many total minutes people spent riding each hour of the day with the radar enabled across all the rides uploaded to mybiketraffic.com.
I quickly realized this was going to be challenging because that meant looking at the raw data, which I had been storing as compressed JSON files rather than importing into the database. I knew from work on a previous project that storing every second of every ride in a database would quickly lead to a huge unwieldy database. This was a good decision for scalability as my site has grown to almost 12,000 users who have uploaded at least one ride with radar data from 97 different countries. Yet, the database has grown only to about 1GB of summary vehicle locations, speeds, and counts.
The major downside, however, to this decision not to import every second of the ride into the database was the inability to do the fine-grained analysis required by the topic of this post - time of day traffic density and rider volume.
Storing every second of a ride would require many hundreds of gigabytes in a single table called ride_records. Just my own rides over the past 7 years covering 150,000 miles has over 35 million seconds of data, with each second corresponding to a ride record. There is no way I was going to pull this data from all my users into my production database, so I offloaded a recent snapshot of all the data from all users onto my personal computer and started running several scripts to first decompress the JSON files and convert them to CSV files to make it easier to use a LOAD DATA command to load the csv data into the table on a non-production database.

Decompressing and exporting took several hours generating nearly 300GB of CSV files, one file for each user with each row in the spreadsheet corresponding to a single second of a ride:

Note that the screenshot above is only about 20 seconds of a single ride from a single user. This is why I didn’t originally import ALL of the ride data into the database!
Because I don’t have 300GB of disk space free on my mac, I started the import from across the network and frantically looked for things I could delete and/or move to external storage. I found enough hoarded data to delete or continue hoarding on external storage, and the import was able to finish.
COMPLEX QUERIES FOR SIMPLE RESULTS
The graphs with the results in the TLDR at the top of this post are relatively simple to understand, but generating the results was quite complex.
Step 1 - Figure out how many minutes collectively were ridden by all riders in each hour of the day.
Step 2 - Count how many passes occurred collectively in each hour of the day
Step 3 - Divide the result of step 1 by step 2 to calculate the normalized cars per minute traffic density
Step 4 - Repeat steps 1 - 3 for various filters: summer months only, non-summer months only, weekdays only, and weekends only.
Sounds simple right? Well, let me say it for the millionth time, dealing with time on a global scale in a software system is always hard … full stop.
My ride_records table stores all timestamps in UTC time, but I also look up the lat/lng for the starting point of each ride to figure out the local time for the ride by looking up the UTC timezone offset (including daylight savings time) for the location where the ride started. So figuring out whether a rider was riding at a given second during a particular “local_hour” requires joining with rides to extract the timezone offsets. I knew I would be running the query multiple times with multiple filters, so I decided to go ahead and pre-populate a local_hour field and a local_minute field in the ride_records table directly to avoid having to do a complex join each time I run the query.
The problem, however, was that across all my users there are more than 1.5B rows of data representing the 1.5B seconds my users have collectively ridden over the past 7 years (with most users creating accounts only in the last couple years). This is only half of the data they have uploaded, but my production server has fallen far behind in processing the data. So there is another 1.5B seconds of data that needs to be processed and imported into the ride_records table. That being said 1.5B seconds of data across nearly 12,000 riders should give me a good approximation to the overall results.
COMPLETE QUERIES
I am sure these queries are correct, but for accountability, any experts out there want to verify whether there might be something I have missed in the queries? Since my radar doesn’t count cars while the rider is not moving to prevent inadvertent inflation of the data by standing beside a road while a bunch of cars pass, I only count the time during an hour where the rider is moving (rr.spd > 0) and they have the radar enabled (rr.extra_pairs NOT LIKE ‘%-1%’).
-- WEEKDAY rides (all year)

WITH ride_mins AS (
  SELECT
    rr.local_hour,
    ROUND(COUNT(*) / 60, 2) AS minutes_total,
    COUNT(DISTINCT rr.ride_id) AS distinct_rides,
    COUNT(DISTINCT r.user_id) AS distinct_riders
  FROM ride_records AS rr
  JOIN rides AS r
    ON rr.ride_id = r.id
  WHERE
    rr.spd > 0
    AND rr.extra_pairs NOT LIKE '%-1%'
    AND WEEKDAY(FROM_UNIXTIME(ts)) BETWEEN 0 AND 4  -- Monday (0) to Friday (4)
  GROUP BY rr.local_hour
),
pass_counts AS (
  SELECT
    wp.local_hour,
    COUNT(*) AS pass_count
  FROM way_passes AS wp
  WHERE
    WEEKDAY(utctimestamp) BETWEEN 0 AND 4
  GROUP BY wp.local_hour
)
SELECT
  pc.local_hour,
  pc.pass_count,
  rm.minutes_total,
  rm.distinct_rides,
  rm.distinct_riders,
  ROUND(pc.pass_count / rm.minutes_total, 4) AS cars_per_minute
FROM pass_counts AS pc
JOIN ride_mins AS rm
  ON pc.local_hour = rm.local_hour
ORDER BY cars_per_minute DESC;

-- WEEKEND rides (all year)

WITH ride_mins AS (
  SELECT
    rr.local_hour,
    ROUND(COUNT(*) / 60, 2) AS minutes_total,
    COUNT(DISTINCT rr.ride_id) AS distinct_rides,
    COUNT(DISTINCT r.user_id) AS distinct_riders
  FROM ride_records AS rr
  JOIN rides AS r
    ON rr.ride_id = r.id
  WHERE
    rr.spd > 0
    AND rr.extra_pairs NOT LIKE '%-1%'
    AND WEEKDAY(FROM_UNIXTIME(rr.ts)) IN (5, 6)  -- Saturday (5), Sunday (6)
  GROUP BY rr.local_hour
),
pass_counts AS (
  SELECT
    wp.local_hour,
    COUNT(*) AS pass_count
  FROM way_passes AS wp
  WHERE
    WEEKDAY(wp.utctimestamp) IN (5, 6)
  GROUP BY wp.local_hour
)
SELECT
  pc.local_hour,
  pc.pass_count,
  rm.minutes_total,
  rm.distinct_rides,
  rm.distinct_riders,
  ROUND(pc.pass_count / rm.minutes_total, 4) AS cars_per_minute
FROM pass_counts AS pc
JOIN ride_mins AS rm
  ON pc.local_hour = rm.local_hour
ORDER BY cars_per_minute DESC;

-- WEEKDAY RIDES summer only (June, July, August)

WITH ride_mins AS (
  SELECT
    local_hour,
    ROUND(COUNT(*) / 60, 2) AS minutes_total,
    COUNT(DISTINCT rr.ride_id) AS distinct_rides,
    COUNT(DISTINCT r.user_id) AS distinct_riders
  FROM ride_records AS rr
  JOIN rides AS r
    ON rr.ride_id = r.id
  WHERE
    MONTH(FROM_UNIXTIME(ts)) IN (6, 7, 8)
    AND WEEKDAY(FROM_UNIXTIME(ts)) BETWEEN 0 AND 4
    AND rr.spd > 0
    AND rr.extra_pairs NOT LIKE '%-1%'
  GROUP BY local_hour
),
pass_counts AS (
  SELECT
    wp.local_hour,
    COUNT(*) AS pass_count
  FROM way_passes AS wp
  WHERE
    MONTH(wp.utctimestamp) IN (6, 7, 8)
    AND WEEKDAY(wp.utctimestamp) BETWEEN 0 AND 4
  GROUP BY wp.local_hour
)
SELECT
  pc.local_hour,
  pc.pass_count,
  rm.minutes_total,
  rm.distinct_rides,
  rm.distinct_riders,
  ROUND(pc.pass_count / rm.minutes_total, 4) AS cars_per_minute
FROM pass_counts AS pc
JOIN ride_mins AS rm ON pc.local_hour = rm.local_hour
ORDER BY cars_per_minute DESC;

-- WEEKEND RIDES summer only (June, July, August)

WITH ride_mins AS (
  SELECT
    local_hour,
    ROUND(COUNT(*) / 60, 2) AS minutes_total,
    COUNT(DISTINCT rr.ride_id) AS distinct_rides,
    COUNT(DISTINCT r.user_id) AS distinct_riders
  FROM ride_records AS rr
  JOIN rides AS r
    ON rr.ride_id = r.id
  WHERE
    MONTH(FROM_UNIXTIME(ts)) IN (6, 7, 8)
    AND WEEKDAY(FROM_UNIXTIME(ts)) IN (5, 6)
    AND rr.spd > 0
    AND rr.extra_pairs NOT LIKE '%-1%'
  GROUP BY local_hour
),
pass_counts AS (
  SELECT
    wp.local_hour,
    COUNT(*) AS pass_count
  FROM way_passes AS wp
  WHERE
    MONTH(wp.utctimestamp) IN (6, 7, 8)
    AND WEEKDAY(wp.utctimestamp) IN (5, 6)
  GROUP BY wp.local_hour
)
SELECT
  pc.local_hour,
  pc.pass_count,
  rm.minutes_total,
  rm.distinct_rides,
  rm.distinct_riders,
  ROUND(pc.pass_count / rm.minutes_total, 4) AS cars_per_minute
FROM pass_counts AS pc
JOIN ride_mins AS rm ON pc.local_hour = rm.local_hour
ORDER BY cars_per_minute DESC;

-- WEEKDAY RIDES non-summer (excludes June, July, August)

WITH ride_mins AS (
  SELECT
    local_hour,
    ROUND(COUNT(*) / 60, 2) AS minutes_total,
    COUNT(DISTINCT rr.ride_id) AS distinct_rides,
    COUNT(DISTINCT r.user_id) AS distinct_riders
  FROM ride_records AS rr
  JOIN rides AS r
    ON rr.ride_id = r.id
  WHERE
    MONTH(FROM_UNIXTIME(ts)) NOT IN (6, 7, 8)
    AND WEEKDAY(FROM_UNIXTIME(ts)) BETWEEN 0 AND 4
    AND rr.spd > 0
    AND rr.extra_pairs NOT LIKE '%-1%'
  GROUP BY local_hour
),
pass_counts AS (
  SELECT
    wp.local_hour,
    COUNT(*) AS pass_count
  FROM way_passes AS wp
  WHERE
    MONTH(wp.utctimestamp) NOT IN (6, 7, 8)
    AND WEEKDAY(wp.utctimestamp) BETWEEN 0 AND 4
  GROUP BY wp.local_hour
)
SELECT
  pc.local_hour,
  pc.pass_count,
  rm.minutes_total,
  rm.distinct_rides,
  rm.distinct_riders,
  ROUND(pc.pass_count / rm.minutes_total, 4) AS cars_per_minute
FROM pass_counts AS pc
JOIN ride_mins AS rm ON pc.local_hour = rm.local_hour
ORDER BY cars_per_minute DESC;

-- WEEKEND RIDES non-summer (excludes June, July, August)

WITH ride_mins AS (
  SELECT
    local_hour,
    ROUND(COUNT(*) / 60, 2) AS minutes_total,
    COUNT(DISTINCT rr.ride_id) AS distinct_rides,
    COUNT(DISTINCT r.user_id) AS distinct_riders
  FROM ride_records AS rr
  JOIN rides AS r
    ON rr.ride_id = r.id
  WHERE
    MONTH(FROM_UNIXTIME(ts)) NOT IN (6, 7, 8)
    AND WEEKDAY(FROM_UNIXTIME(ts)) IN (5, 6)
    AND rr.spd > 0
    AND rr.extra_pairs NOT LIKE '%-1%'
  GROUP BY local_hour
),
pass_counts AS (
  SELECT
    wp.local_hour,
    COUNT(*) AS pass_count
  FROM way_passes AS wp
  WHERE
    MONTH(wp.utctimestamp) NOT IN (6, 7, 8)
    AND WEEKDAY(wp.utctimestamp) IN (5, 6)
  GROUP BY wp.local_hour
)
SELECT
  pc.local_hour,
  pc.pass_count,
  rm.minutes_total,
  rm.distinct_rides,
  rm.distinct_riders,
  ROUND(pc.pass_count / rm.minutes_total, 4) AS cars_per_minute
FROM pass_counts AS pc
JOIN ride_mins AS rm ON pc.local_hour = rm.local_hour
ORDER BY cars_per_minute DESC;
Hi Brian - love that you are still into all things cycling. I might have missed it in the article, but what device(s) did you use to gather the telemetry from the riders?
Also, is the end result of the investigation potentially to result in any sort of safety recommendation - such as when to ride, or where not to ride based on car encounters?
And then on the non-academic side, when is your next long multi-day ride going to be? :-)